|
|
|
| Title | Graph a parametric function (X(t), Y(t)) on a PictureBox |
|---|
| Description | This example shows how to graph a parametric function (X(t), Y(t)) on a PictureBox in Visual Basic 6. It uses the PictureBox's Scale properties to set a convenient scale, draws X and Y axes, and then draws the parametric curve. |
|---|
| Keywords | graph, parametric, parametric equations, PictureBox |
|---|
| Categories | Graphics, Controls |
|---|
|
|
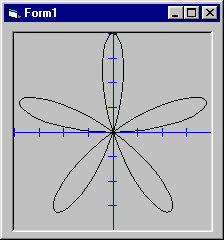
The program uses the PictureBox's Scale properties to set a convenient scale. In this case, X and Y range from -2 to 2.
Next the program draws the X and Y axes with tick marks. It then make parametric variable t run from 0 to 2 * Pi, connecting the points generated by the functions X(t) = r * Cos(t) and Y(t) = r * Sin(t), where r = 2 * Sin(5 * t).
|
|
Private Sub Form_Load()
Const PI = 3.14159265
Dim x As Single
Dim y As Single
Dim r As Single
Dim t As Single
Dim dt As Single

    ' Set a convenient scale.
    picGraph.AutoRedraw = True
    picGraph.Scale (-2, 2)-(2, -2)

    ' Draw axes.
    picGraph.Line (-2, 0)-(2, 0), vbBlue
    For x = -2 To 2 Step 0.5
        picGraph.Line (x, -0.1)-(x, 0.1), vbBlue
    Next x
    picGraph.Line (0, -2)-(0, 2), vbBlue
    For y = -2 To 2 Step 0.5
        picGraph.Line (-0.1, y)-(0.1, y), vbBlue
    Next y

    ' Draw the parametric curve.
    t = 0
    dt = PI / 100
    picGraph.CurrentX = 0
    picGraph.CurrentY = 0
    Do While t <= 2 * PI
        r = 2 * Sin(5 * t)
        x = r * Cos(t)
        y = r * Sin(t)
        picGraph.Line -(x, y)
        t = t + dt
    Loop
    picGraph.Line -(0, 0)
End Sub
|
| |

|
| |
|
|


