|
|
|
| Title | Graph historical stock prices in Visual Basic .NET |
|---|
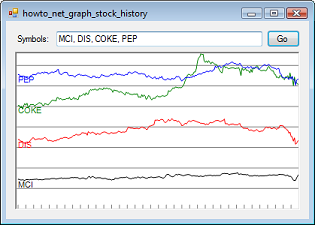
| Description | This example shows how to graph historical stock prices in Visual Basic .NET. |
|---|
| Keywords | graphics, stocks, stock prices, graph, example, example program, Windows Forms programming, VB.NET, Visual Basic .NET |
|---|
| Categories | Algorithms |
|---|
|
|
The key to this example is the GetStockPrices method shown in the following code.
|
|
' Get the prices for this symbol.
Private Function GetStockPrices(ByVal symbol As String) As _
    List(Of Single)
    ' Compose the URL.
    Dim url As String = _
        "http://www.google.com/finance/historical?output=csv&q=" _
        & symbol

    ' Get the result.
    ' Get the web response.
    Dim result As String = GetWebResponse(url)

    ' Get the historical prices.
    Dim lines() As String = result.Split( _
        New String() {vbCr, vbLf}, _
        StringSplitOptions.RemoveEmptyEntries)
    Dim prices As New List(Of Single)()

    ' Process the lines, skipping the header.
    For i As Integer = 1 To lines.Length - 1
        Dim line As String = lines(i)
        prices.Add(Single.Parse(line.Split(","c)(4)))
    Next i

    Return prices
End Function
|
|
|
This method composes a URL of the form http://www.google.com/finance/historical?output=csv&q=DIS where DIS is a stock ticker symbol. The Google website returns historical stock data for that symbol in the form of a CSV (comma-separated value) file. The program breaks it into lines and saves the prices in a List of float that it returns to the calling code.
For additional information about how the program works, including how it draws the graph and how the GetWebResponse method works, download the example and look at the code.
|
| |
|
|
| |
| |
 |
| |
|
|


