|
|
|
| Title | Plot the equation of a function of two variables in Visual Basic .NET |
|---|
| Description | This example shows how to plot the equation of a function of two variables in Visual Basic .NET. |
|---|
| Keywords | graph, plot, graph equation, plot equation, graphics, algorithms, geometry, Visual Basic, Visual Basic .NET, VB.NET |
|---|
| Categories | Graphics, Algorithms |
|---|
|
|
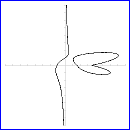
Some equations, such as y = 3 * x + 5, are easy to graph. Others are much harder. For example, how do you graph the following equation?
x3 / (Abs(y) + 1) - 4 * x2 + 4 * x * y2 - y * 6 + 6 = 0
I don't know about you, but I wouldn't have guessed that this equation's graph looked like the figure on the right.
This program demonstrates one way to handle this problem.
First, of the equation is not already in the form F(x, y) = 0, convert it into that format. If the equation has non-zero pieces on each side of the equal sign, simply subtract one side to move it to the other. For example, the equation y = 3 * x + 5 is equivalent to y - (3 * x + 5) = 0.
Now the program loops over the area to plot. For each point in the area, it calculates the value of the function at that point and the next point vertically and horizontally. If the sign of the values is different, then the function's value crossed from < 0 to > 0 or vice versa. In that case, the intermediate value theorem says the function must have taken the value 0 somewhere in that range (assuming the function is continuous) so the program plots the point.
The following code shows how the program loops over the area plotting points.
|
|
' Plot a function.
Private Sub PlotFunction(ByVal gr As Graphics, _
  ByVal xmin As Single, ByVal ymin As Single, _
  ByVal xmax As Single, ByVal ymax As Single, _
  ByVal dx As Single, ByVal dy As Single)

    ' Plot the function.
    Using thin_pen As New Pen(Color.Black, 0)
        ' Horizontal comparisons.
        For x As Single = xmin To xmax Step dx
            Dim last_y As Single = F1(x, ymin)
            For y As Single = ymin + dy To ymax Step dy
                Dim next_y As Single = F1(x, y)
                If ( _
                    ((last_y <= 0.0F) AndAlso (next_y >= _
                        0.0F)) OrElse _
                    ((last_y >= 0.0F) AndAlso (next_y <= _
                        0.0F)) _
                   ) _
                Then
                    ' Plot this point.
                    gr.DrawLine(thin_pen, x, y - dy, x, y)
                End If
                last_y = next_y
            Next y
        Next x ' Horizontal comparisons.

        ' Vertical comparisons.
        For y As Single = ymin + dy To ymax Step dy
            Dim last_x As Single = F1(xmin, y)
            For x As Single = xmin + dx To xmax Step dx
                Dim next_x As Single = F1(x, y)
                If ( _
                    ((last_x <= 0.0F) AndAlso (next_x >= _
                        0.0F)) OrElse _
                    ((last_x >= 0.0F) AndAlso (next_x <= _
                        0.0F)) _
                   ) _
                Then
                    ' Plot this point.
                    gr.DrawLine(thin_pen, x - dx, y, x, y)
                End If
                last_x = next_x
            Next x
        Next y ' Vertical comparisons.
    End Using ' using thin_pen.
End Sub

' The function.
' x3 / (Abs(y) + 1) - 4 * x2 + 4 * x * y2 - y * 6 + 6 = 0
Private Function F1(ByVal x As Single, ByVal y As Single) _
    As Single
    Return (x * x * x / _
        (Math.Abs(y) + 1) - 4 * x * x + 4 * x * y * y - y * _
            6 + 6)
End Function
|
| |

|
| |
|
|


