|
|
|
| Title | Plot a smiley face function in Visual Basic .NET |
|---|
| Description | This example shows how to plot a smiley face function in Visual Basic .NET. |
|---|
| Keywords | delegate, plot, graph, plot function, graph function, graphics, algorithms, smiley face, smiley, plot smiley face, graph smiley face, Visual Basic .NET, VB.NET |
|---|
| Categories | VB.NET, Software Engineering, Algorithms, Graphics |
|---|
|
|
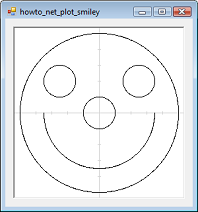
What do the graphs of the following two equations look like?
    [x^2 + y^2 - 225] *
    [x^2 + y^2 - 10000] *
    [(x - 45)^2 + (y - 35)^2 - 225] *
    [(x + 45)^2 + (y - 35)^2 - 225] = 0

    [y + Sqrt(16 - x^2)] = 0
To find out, you can use the examples:
This example uses the PlotFunction method from the first of the previous examples in the following calls:
|
|
PlotFunction(gr, AddressOf F1, -6, -6, 6, 6, dx, dy)
PlotFunction(gr, AddressOf F2, -6, -6, 6, 6, dx, dy)
|
|
|
Here F1 and F2 are simply functions that return the values of the two functions.
|
| |

|
| |
|
|


