|
|
|
| Title | Draw a Sierpinski fractal curve in Visual Basic .NET |
|---|
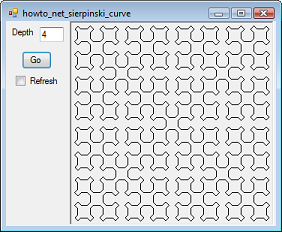
| Description | This example shows how to draw a Sierpinski fractal curve in Visual Basic .NET. |
|---|
| Keywords | example program, Sierpinski curve, space-filling curve, example, Windows Forms programming, fractal, Visual Basic .NET, VB.NET |
|---|
| Categories | Graphics, Algorithms, Graphics |
|---|
|
|

The Sierpinski curve is a space-filling curve that is in some ways similar to the Hilbert curve.
The curve is drawn by 4 functions named SierpA, SierpB, SierpC, and SierpD that draw curves across the top, right, bottom, and left sides of the area being drawn.
Each of the functions calls other functions to do the work. For example, SierpA calls itself to draw a horizontal section, draws a line down and to the right, calls SierpB to draw down, draws a horizontal segment, calls SierpD, draws another segment, and finishes by calling SierpA.
The following code shows the SierpA function. If you check the Refresh checkbox, the function refreshes the image on the screen so you can see the curve as it is drawn.
|
|
' Draw right across the top.
Private Sub SierpA(ByVal gr As Graphics, ByVal depth As _
    Integer, ByVal dx As Single, ByVal dy As Single, ByRef x _
    As Single, ByRef y As Single)
    If (depth > 0) Then
        depth -= 1

        SierpA(gr, depth, dx, dy, x, y)
        DrawRel(gr, x, y, dx, dy)
        SierpB(gr, depth, dx, dy, x, y)
        DrawRel(gr, x, y, 2 * dx, 0)
        SierpD(gr, depth, dx, dy, x, y)
        DrawRel(gr, x, y, dx, -dy)
        SierpA(gr, depth, dx, dy, x, y)
    End If

    If (m_Refresh) Then picCanvas.Refresh()
End Sub
|
|
The Sierpinski function shown in the following code puts the pieces together by calling each of the other functions to draw part of the whole curve.
|
|
' Draw a Sierpinski curve.
Private Sub Sierpinski(ByVal gr As Graphics, ByVal depth As _
    Integer, ByVal dx As Single, ByVal dy As Single)
    Dim x As Single = 2 * dx
    Dim y As Single = dy

    SierpA(gr, depth, dx, dy, x, y)
    DrawRel(gr, x, y, dx, dy)
    SierpB(gr, depth, dx, dy, x, y)
    DrawRel(gr, x, y, -dx, dy)
    SierpC(gr, depth, dx, dy, x, y)
    DrawRel(gr, x, y, -dx, -dy)
    SierpD(gr, depth, dx, dy, x, y)
    DrawRel(gr, x, y, dx, -dy)

    picCanvas.Refresh()
End Sub
|
|
|
As a point of interest, note that space-filling curves like this one and the Hilbert curve can give approximate solutions to the Traveling Salesperson Problem (TSP) where the goal is to visit a series of points and return to a starting point while following the shortest possible path. Simply overlay a space-filling curve on the map of the area and visit the points in the order in which the target points are visited by the curve. The result isn't perfect but it's a pretty good start.
|
| |
|
|
| |
| |
 |
| |
|
|


